2. Dashboard
2.1. Dashboard
Dashboard shows the performance capture of real-time or historical metrics associate with your account.
The top navbar allows you to filter your data by date range, Campaign, Placement and Deal. You can specify a time period for data, you also can select from today as real time.
Note: For more information of metrics descriptions in Dashboard, see the “Abbreviation & Glossary”.
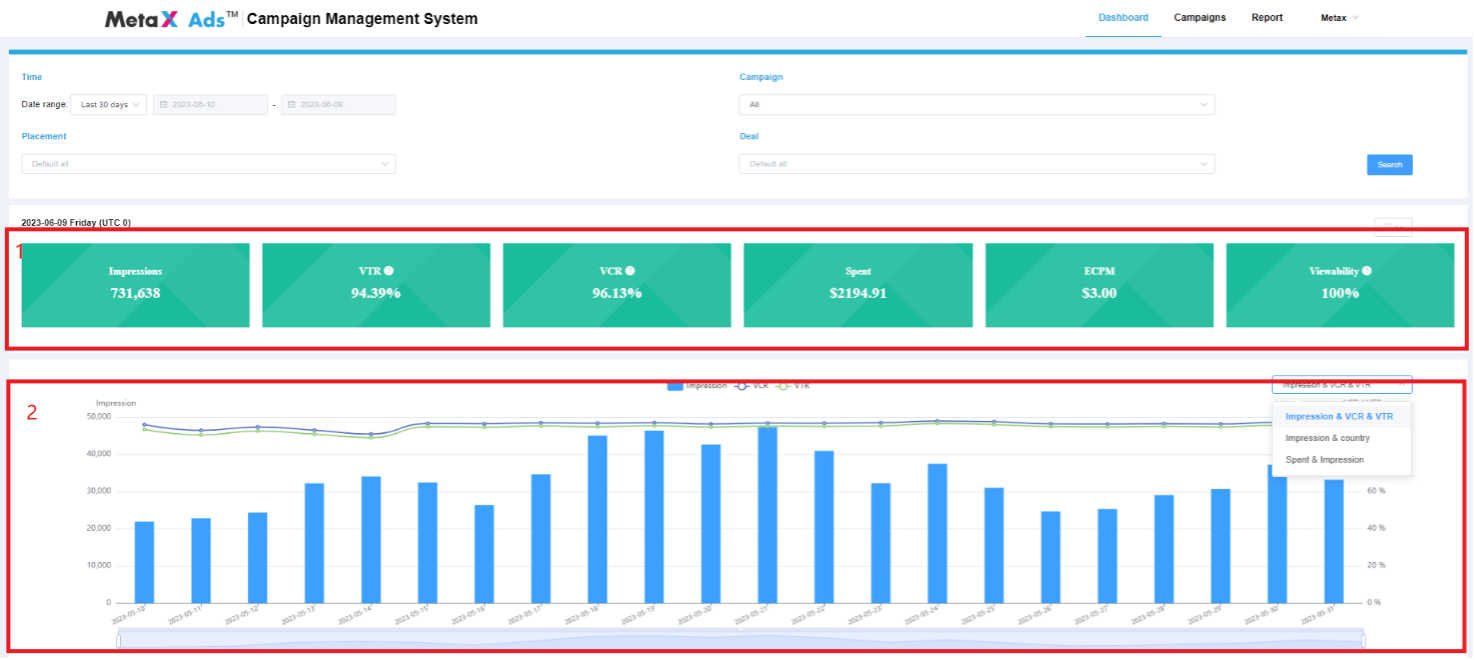
The dashboard is broken into four sections:
Key Performance Indicators: Impressions, VTR, VCR, Spent, ECPM, Viewability.
Daily Trend Indicators: this part provides information about the daily performance. There are three charts with different dimensions, “Impression & VCR & VTR”, “Impression & Country” and “Spent & Impression”, you can select on the upper right corner in part two.
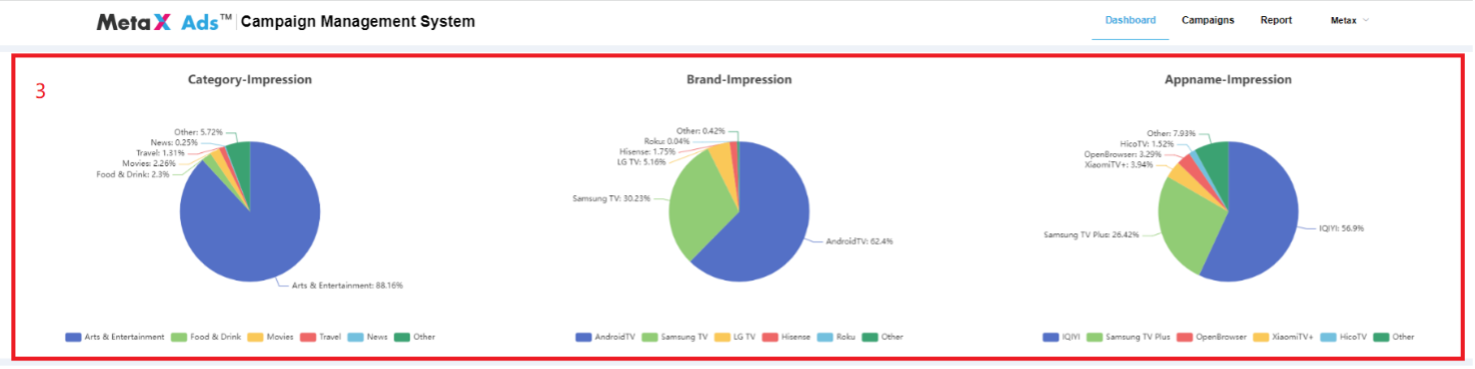
Analysis: this part provides the break down the impressions of the dimensions Category, Brand and App which your ads server.
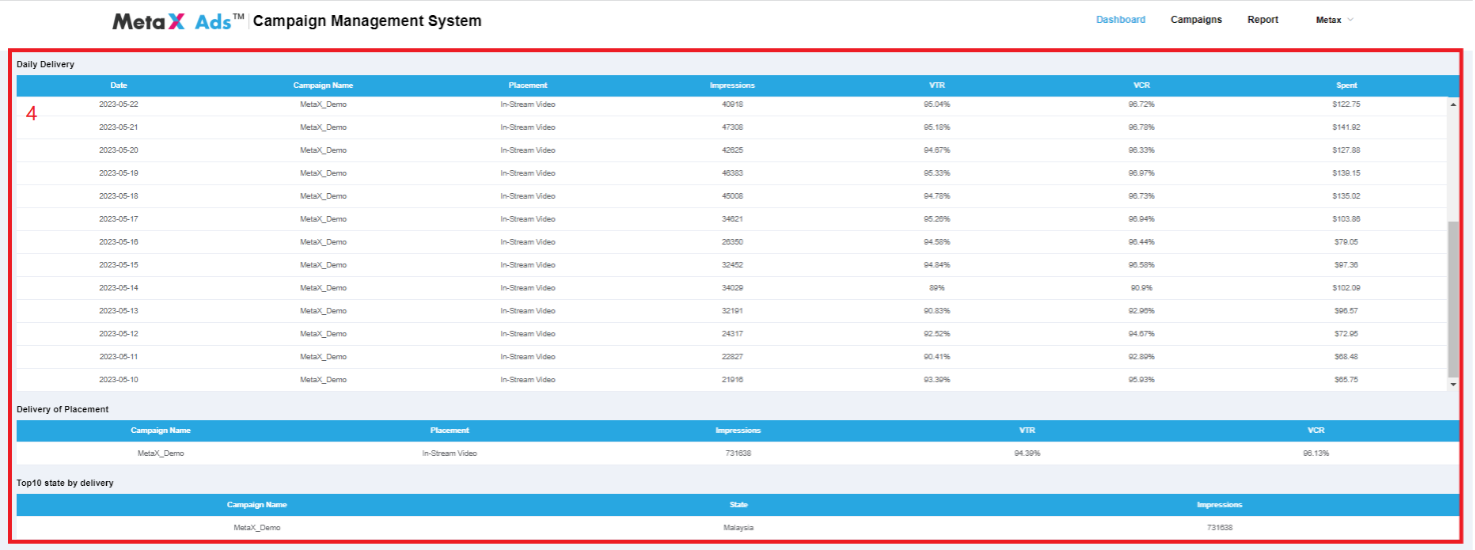
Daily Summary: this part provides information about the daily performance of your campaigns.